[ad_1]
Monday, September 17: crypto markets are today largely green, but scattered mild corrections are affecting several major-market-cap altcoins, as data from Coin360 shows.

Market visualization by Coin360
Bitcoin (BTC) is just a fraction of a percent down on the day to trade at $6,484 to press time. Having reclaimed the $6,500 price point September 13, the top coin failed to break through to a yet higher level, but has instead jaggedly circled to consolidate the $6,500 mark.
Despite a brief dip earlier today below $6,460, Bitcoin has since somewhat rebounded in the hours before press time.
On the week, Bitcoin is up almost 4 percent, with monthly gains at a modest 2.66 percent.

Bitcoin 24-hour price chart. Source: Cointelegraph Bitcoin Price Index
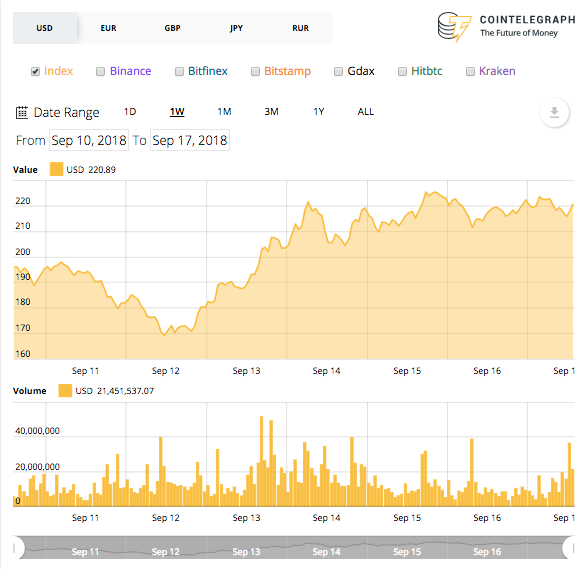
Ethereum (ETH) is today trading around $219 to press time, down just half of a percent on the day. The top alt has been on a tear as of the evening of September 12, seeing double-digit growth to rebound from its intraweek dip to below $170 back to a comfortable $50 higher.
Over the past couple of days, Ethereum has cleaved close to the $220 mark, only losing ground briefly yesterday, September 16.
Ethereum is up a bullish 11.8 percent on its weekly chart, and has significantly closed down its losses on the month, which are now at 23.5 percent.

Ethereum 7-day price chart. Source: Cointelegraph Ethereum Price Index
Among the other top ten coins on CoinMarketCap, most are seeing modest gains capped at 2 percent maximum. Stellar (XLM), ranked 6th, is the strongest performer over the 24-hour-period, up 1.9 percent to trade at $0.208 to press time.
Bitcoin Cash (BCH), trading at $447.11, is up 1.14 percent, while Cardano (ADA) is seeing smaller growth, up 0.7 percent at $0.069.
Litecoin (LTC) has shed around 1 percent in value on the day and is trading at $55.89.
Among the top twenty coins by market cap, most gains and losses are mostly within a 2 percent range either way, with the exception of Dash (DASH), ranked 11th, which has sealed a solid 4.3 growth on the day and is trading at $196.81 to press time.
TRON (TRX) and NEM (XEM) are both up by 1.1 and 1.5 percent on the day respectively, while Vechain (VEC) has seen the heftiest loss – a still mild 2.25 percent to trade at $0.014.
Total market capitalization has been fluctuating on the day. After briefly spiking as high as $204.4 billion earlier today, it has since declined to $202.6 billion as of press time.
The week has has seen a jagged but nonetheless consistent recovery since total market cap dipped as low as around $186.3 billion September 12.

7-day chart of the total market capitalization of all cryptocurrencies from CoinMarketCap
A Cointelegraph analysis piece this weekend gave insights into the oft-repeated analogy drawn between the crypto bear markets and the dotcom bubble. As Bloomberg reported earlier this week, VanEck’s MVIS CryptoCompare Digital Assets 10 Index – which tracks the prices of top ten digital assets – was down 80 percent as compared with its January high. The data thus represents a heftier plummet than the Nasdaq Composite Index’s 78 percent nosedive at the height of the dot-com crash.
Nevertheless, as CT’s analyst argued, key structural differences – including a significantly smaller total market cap size for crypto and the fact that retail investors have a significant footprint in the crypto industry, unlike the venture capitalists of the dotcom days – means that such comparisons are not necessarily as clear-cut as the figures may at first glance suggest.
[ad_2]
Source link


